
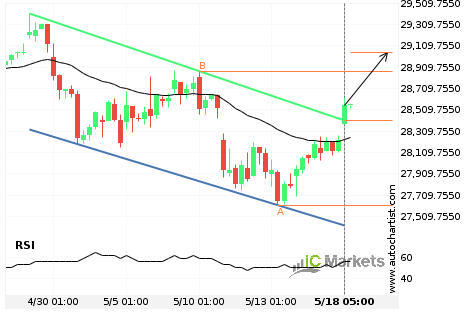
Hong Kong 50 Index has broken through resistance
Hong Kong 50 Index has broken through the resistance line of a Channel Down. It has touched this line at least twice in the last 20 days. This breakout indicates a potential move to 29049.2242 within the next 3 days. Because we have seen it retrace from this positions in the past, one should wait […]

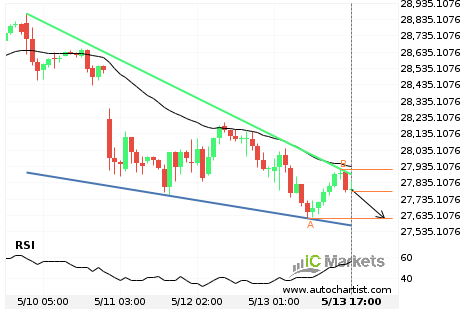
Australia 200 Index – getting close to support of a Channel Down
Australia 200 Index is moving towards the support line of a Channel Down. Because we have seen it retrace from this line before, we could see either a break through this line, or a rebound back to current levels. It has touched this line numerous times in the last 12 days and may test it […]
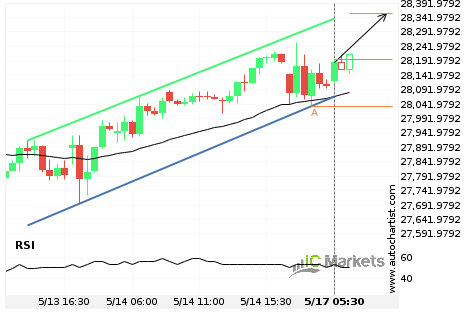
Either a rebound or a breakout imminent on Hong Kong 50 Index
Hong Kong 50 Index is heading towards the resistance line of a Channel Up. If this movement continues, we expect the price of Hong Kong 50 Index to test 28355.3000 within the next 6 hours. But don’t be so quick to trade, it has tested this line numerous times in the past, so this movement […]
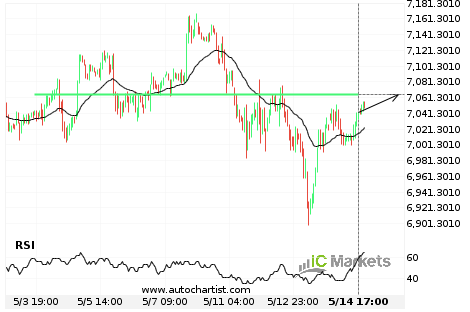
A final push expected on Australia 200 Index
Australia 200 Index is heading towards a price line of 7064.6201 and could reach this point within the next 2 days. It has tested this line numerous times in the past, and this time could be no different from the past, ending in a rebound instead of a breakout. If the breakout doesn’t happen, we […]
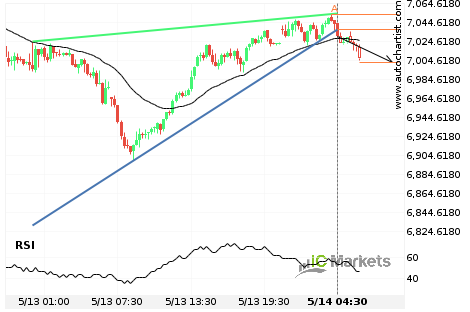
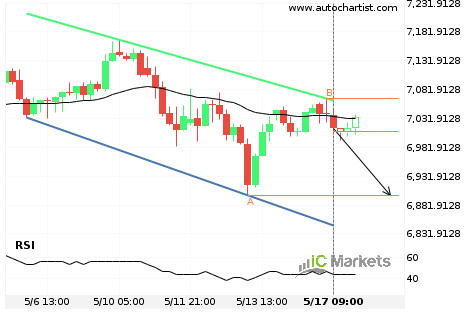
Australia 200 Index has broken through support
Australia 200 Index has broken through the support line of a Rising Wedge. It has touched this line at least twice in the last 2 days. This breakout indicates a potential move to 7002.0435 within the next 7 hours. Because we have seen it retrace from this positions in the past, one should wait for […]

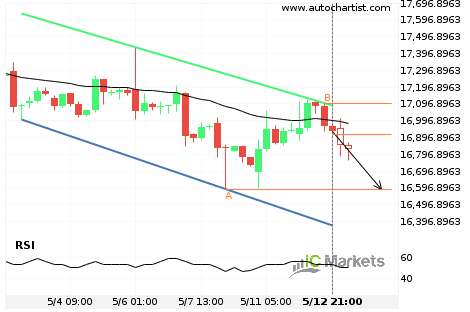
Hong Kong 50 Index – getting close to support of a Falling Wedge
Hong Kong 50 Index is moving towards the support line of a Falling Wedge. Because we have seen it retrace from this line before, we could see either a break through this line, or a rebound back to current levels. It has touched this line numerous times in the last 4 days and may test […]
Should we expect a breakout or a rebound on FTSE China A50 Index?
The movement of FTSE China A50 Index towards the support line of a Channel Down is yet another test of the line it reached numerous times in the past. We expect this line test to happen in the next 2 days, but it is uncertain whether it will result in a breakout through this line, […]